Compressor Selection
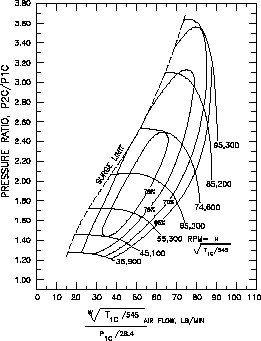
When using the formula's below, you will need to use compressor flow maps and work with the formulas until you size the compressor that will work for your application. Compressor flow maps are available from the manufacturer, do a search on the web, or use the maps I have provided. On the flow maps, the airflow requirements should fall somewhere between the surge line and the 60% efficiency line, the goal should be to get in the peak efficiency range at the point of your power peak. In this article I will walk through an example as I explain it.
Engine Airflow Requirements
In order to select a turbocharger, you must know how much air it must flow to reach your goal. You first need to figure the cubic feet per minute of air flowing through the engine at maximum rpm. The the formula to to this for a 4 stroke engine is:
(CID × RPM) ÷3456 = CFM
For a 2 stroke you divide by 1728 rather than 3456. Lets assume that you are turbocharging a 302 cubic inch engine That will redline at 6000 rpm.
(302 × 6000) ÷ 3456 = 524.3 CFM
The engine will flow 524.3 CFM of air assuming a 100% volumetric efficiency. Most street engines will have an 80-90% VE, so the CFM will need to be adjusted. Lets assume our 302 has an 85% VE.
524.3 × 0.85 = 445.7 CFM
Our 302 will actually flow 445.7 CFM with an 85% VE.
Pressure Ratio
The pressure ratio is simply the pressure in, compared to the pressure out of the turbocharger. The pressure in is usually atmospheric pressure, but may be slightly lower if the intake system before the turbo is restrictive, the inlet pressure could be higher than atmospheric if there is more than 1 turbocharger in series. In that case the inlet let pressure will be the outlet pressure of the turbo before it. If we want 10 psi of boost with atmospheric pressure as the inlet pressure, the formula would look like this:
(10 + 14.7) ÷ 14.7 = 1.68:1 pressure ratio
Temperature Rise
A compressor will raise the temperature of air as it compresses it. As temperature increases, the volume of air also increases. There is an ideal temperature rise which is a temperature rise equivalent to the amount of work that it takes to compress the air. The formula to figure the ideal outlet temperature is:
T2 = T1 (P2 ÷ P1)0.283
Where:
T2 = Outlet Temperature °R
T1 = Inlet Temperature °R
°R = °F + 460
P1 = Inlet Pressure Absolute
P2 = Outlet Pressure Absolute
Lets assume that the inlet temperature is 75° F and we're going to want 10 psi of boost pressure. To figure T1 in °R, you will do this:
T1 = 75 + 460 = 535°R
The P1 inlet pressure will be atmospheric in our case and the P2 outlet pressure will be 10 psi above atmospheric. Atmospheric pressure is 14.7 psi, so the inlet pressure will be 14.7 psi, to figure the outlet pressure add the boost pressure to the inlet pressure.
P2 = 14.7 + 10 = 24.7 psi
For our example, we now have everything we need to figure out the ideal outlet temperature. We must plug this info into out formula to figure out T2:
T1 = 75
P1 = 14.7
P2 = 24.7
The formula will now look like this:
T2 = 535 (24.7 ÷ 14.7)0.283 = 620 °R
You then need to subtract 460 to get °F, so simply do this:
620 - 460 = 160 °F Ideal Outlet Temperature
This is a temperature rise of 85 °F
Adiabatic Efficiency
The above formula assumes a 100% adiabatic efficiency (AE), no loss or gain of heat. The actual temperature rise will certainly be higher than that. How much higher will depend on the adiabatic efficiency of the compressor, usually 60-75%. To figure the actual outlet temperature, you need this formula:
Ideal Outlet Temperature Rise ÷ AE = Actual Outlet Temperature Rise
Lets assume the compressor we are looking at has a 70% adiabatic efficiency at the pressure ratio and flow range we're dealing with. The outlet temperature will then be 30% higher than ideal. So at 70% it using our example, we'd need to do this:
85 ÷ 0.7 = 121 °F Actual Outlet Temperature Rise
Now we must add the temperature rise to the inlet temperature:
75 + 121 = 196 °F Actual Outlet Temperature
Density Ratio
As air is heated it expands and becomes less dense. This makes an increase in volume and flow. To compare the inlet to outlet air flow, you must know the density ratio. To figure out this ratio, use this formula:
(Inlet °R ÷ Outlet °R) × (Outlet Pressure ÷ Inlet Pressure) = Density Ratio
We have everything we need to figure this out. For our 302 example the formula will look like this:
(535 ÷ 656) × (24.7 ÷ 14.7) = 1.37 Density Ratio
Compressor Inlet Airflow
Using all the above information, you can figure out what the actual inlet flow in in CFM. Do do this, use this formula:
Outlet CFM × Density Ratio = Actual Inlet CFM
Using the same 302 in our examples, it would look like this:
447.5 CFM × 1.37 = 610.6 CFM Inlet Air Flow
That is about a 37% increase in airflow and the potential for 37% more power. When comparing to a compressor flow map that is in Pounds per Minute (lbs/min), multiply CFM by 0.069 to convert CFM to lbs/min.
610.6 CFM × 0.069 = 42.1 lbs/min
Now you can use these formula's along with flow maps to select a compressor to match your engine. You should play with a few adiabatic efficiency numbers and pressure ratios to get good results. For twin turbo's, remember that each turbo will only flow 1/2 the total airflow.
Using Your Numbers
A turbocharger compressor map has two axis. On the x-axis (the horizontal one) is the airflow, often in lbs/minute. On the y-axis is the pressure ratio, usually as "1+boost pressure", in bar. Inside the map there are plots for turbine rpm, more or less horizontal lines, efficiency (oval rings) and most often also surge limit - a dotted line.
To use the map, you need to know the airflow you will have through the engine.
Using this value, you can use a map. Draw a line from your air flow (lbs/min) on the x-axis, and a line from the pressure ratio (psi + 14.7 ÷14.7 ). The point of intersection will hopefully be inside one of the higher efficiency rings, about 70%.
You should always have the intersection to the right of the surge limit, otherwise it is no good.
The way to do this is to plot 5-10 intersections (different rpms and boost pressures) in different maps. By having maps for different turbos, and trying different boost pressures and rpm, you can get an idea of how it’s going to work.
Remember this only gives an estimate, you might have to resort to trial and error to get exactly spot on. This way, however, you can be reasonably sure you are in the right ballpark.
1 bar = 14.50377 PSI
1 PSI = 0.06894757 bar